


 65 / 348

2
Societal,
Social
and Environmental Information
Social Indicators
Headcount by Age
Headcount by age
(%)
GRI
UNGC
OECD
G4-10, G4-LA12
1, 6
V
2014
2013
Under 25
25-34
35-44
45-54 55 and over Under 25
25-34
35-44
45-54 55 and over
C+G
8% 40% 34% 15% 3%
7% 38% 36% 16% 3%
UMG
6% 31% 32% 23% 8%
6% 31% 33% 23% 7%
Vivendi Village
13% 56% 24% 6% 1%
11% 58% 23% 7% 1%
Corporate
2% 15% 27% 33% 23%
3% 14% 29% 32% 22%
Sub-total
7% 36% 32% 19% 6% 6% 35% 34% 19% 6%
GVT
20% 49% 24% 6% 1%
20% 50% 23% 6% 1%
Total
14% 43% 28% 12% 3% 14% 43% 28% 12% 3%
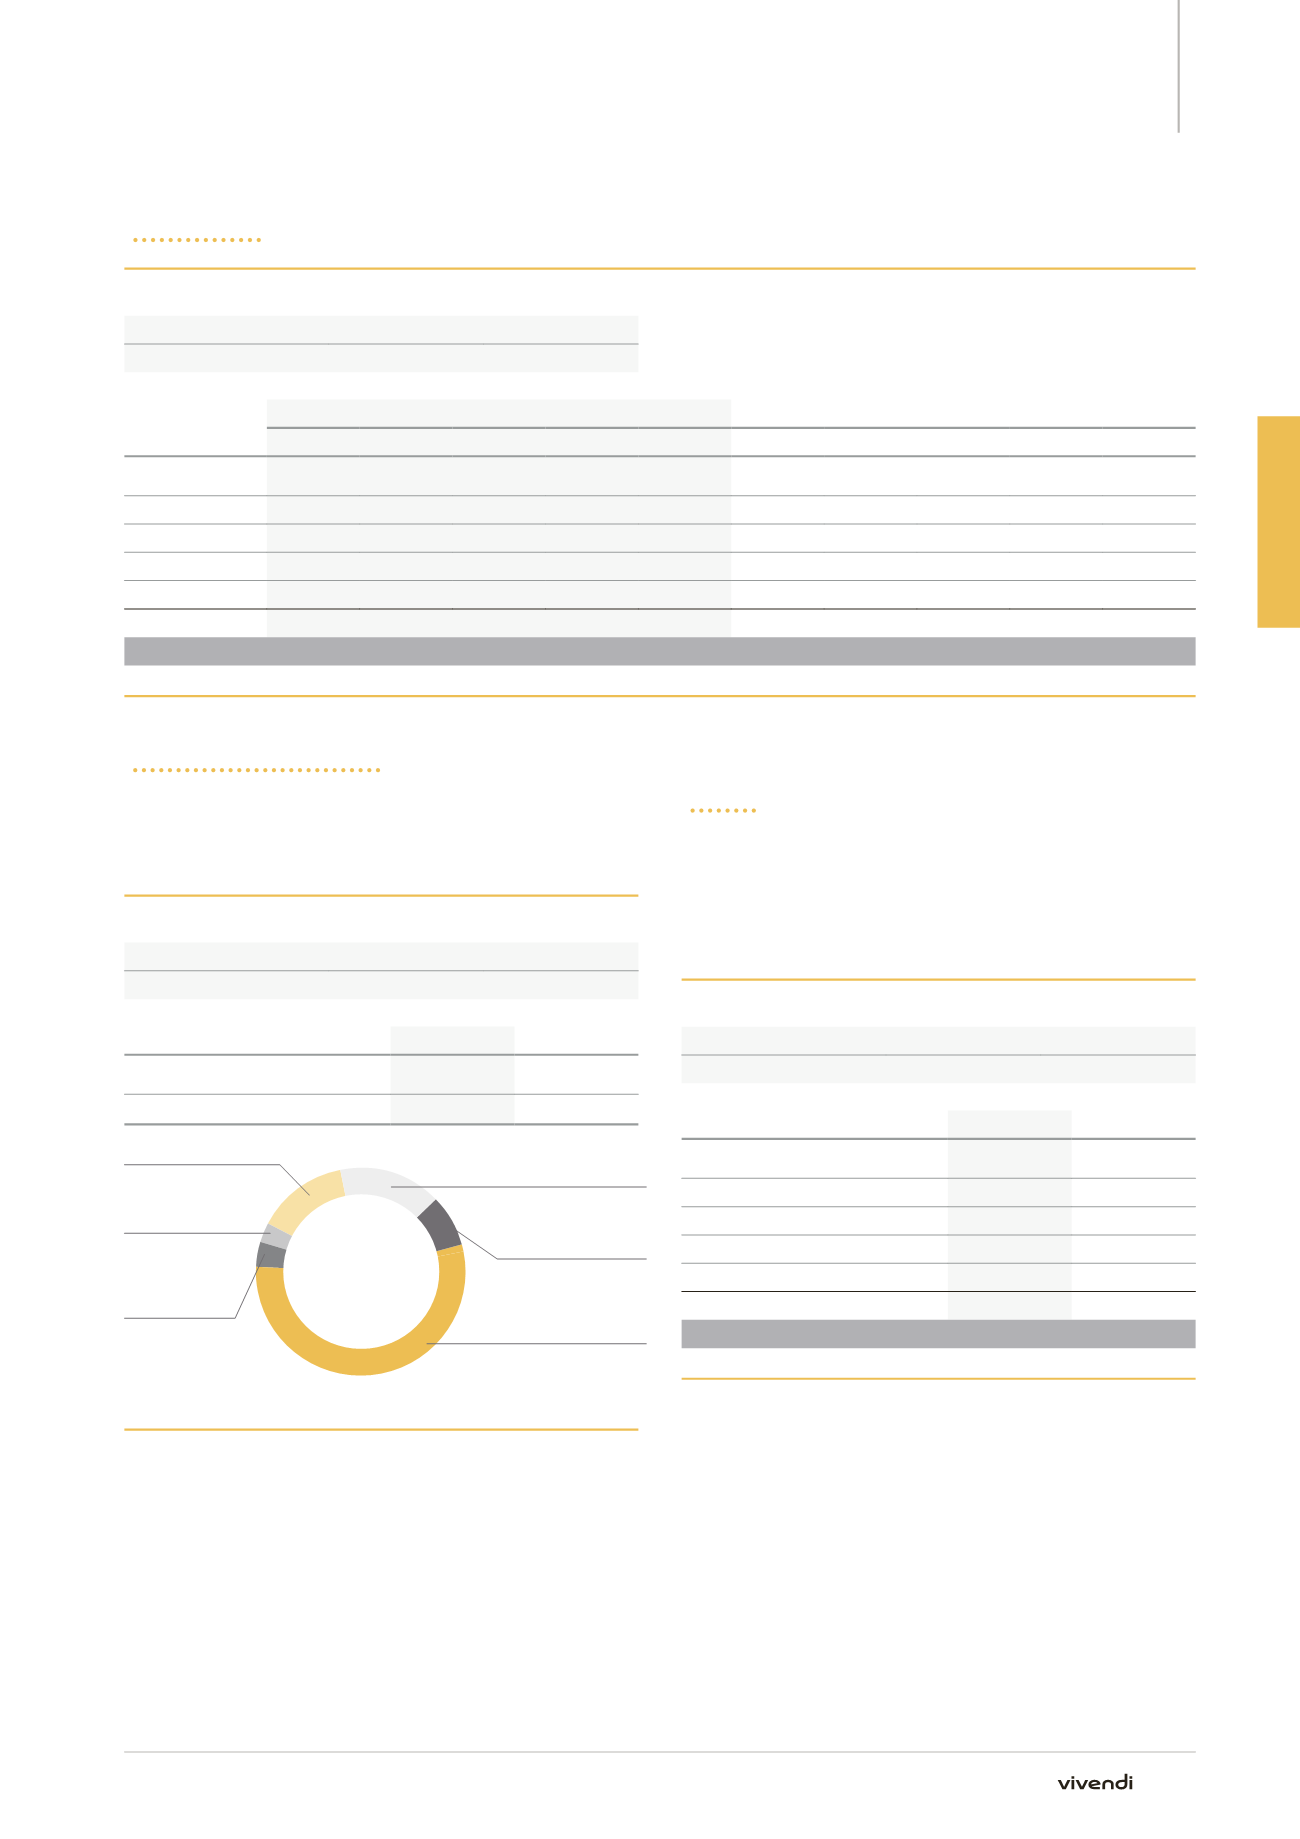
Headcount by Geographic Region
The table below shows the group’s headcount by geographic region
as of December 31, 2014. The heading “France” covers the workforce
of companies in mainland France and its overseas departments and
territories.
Headcount by Geographic Region
GRI
UNGC
OECD
G4-10
-
V
2014
2013
Consolidated data
33,558
32,007
of which GVT
17,987
17,387
2014
France
33,558
5,409 (16%)
North America
2,725 (8%)
South and
Central America
18,346 (55%)
4,753 (14%)
Africa
937 (3%)
Asia-Pacific
1,388 (4%)
of which GVT: 17,987
Europe (excluding France)
■
■
3.2.1.3.
New Hires and Departures
New Hires
Vivendi operates in certain countries where the measurement of new
hires and trainees is markedly different from that of France and other
European countries. Thus, in the United States and Brazil, summer jobs
held by students and temporary positions are considered as new hires.
To take this into account, the table below counts new hires of all kinds,
irrespective of the period of employment.
New Hires in the Group
GRI
UNGC
OECD
G4-LA1
6
V
2014
2013
C+G
1,612
1,515
UMG
1,534
1,420
Vivendi Village
280
324
Corporate
11
4
Sub-total
3,437
3,263
GVT
7,041
7,956
Total
10,478
11,219
The total number of new hires remained relatively unchanged in 2014,
representing the combined effect of growth of the Canal+ Group and
the dynamic performance of GVT, which confirms the attractiveness of
Vivendi’s businesses.
65
Annual Report 2014