201
Annual Report -
2013
-
Vivendi
Financial Report
| Statutory Auditors’ Report on the Consolidated Financial Statements | Consolidated
Financial Statements | Statutory Auditors’ Report on the Financial Statements | Statutory Financial Statements
4
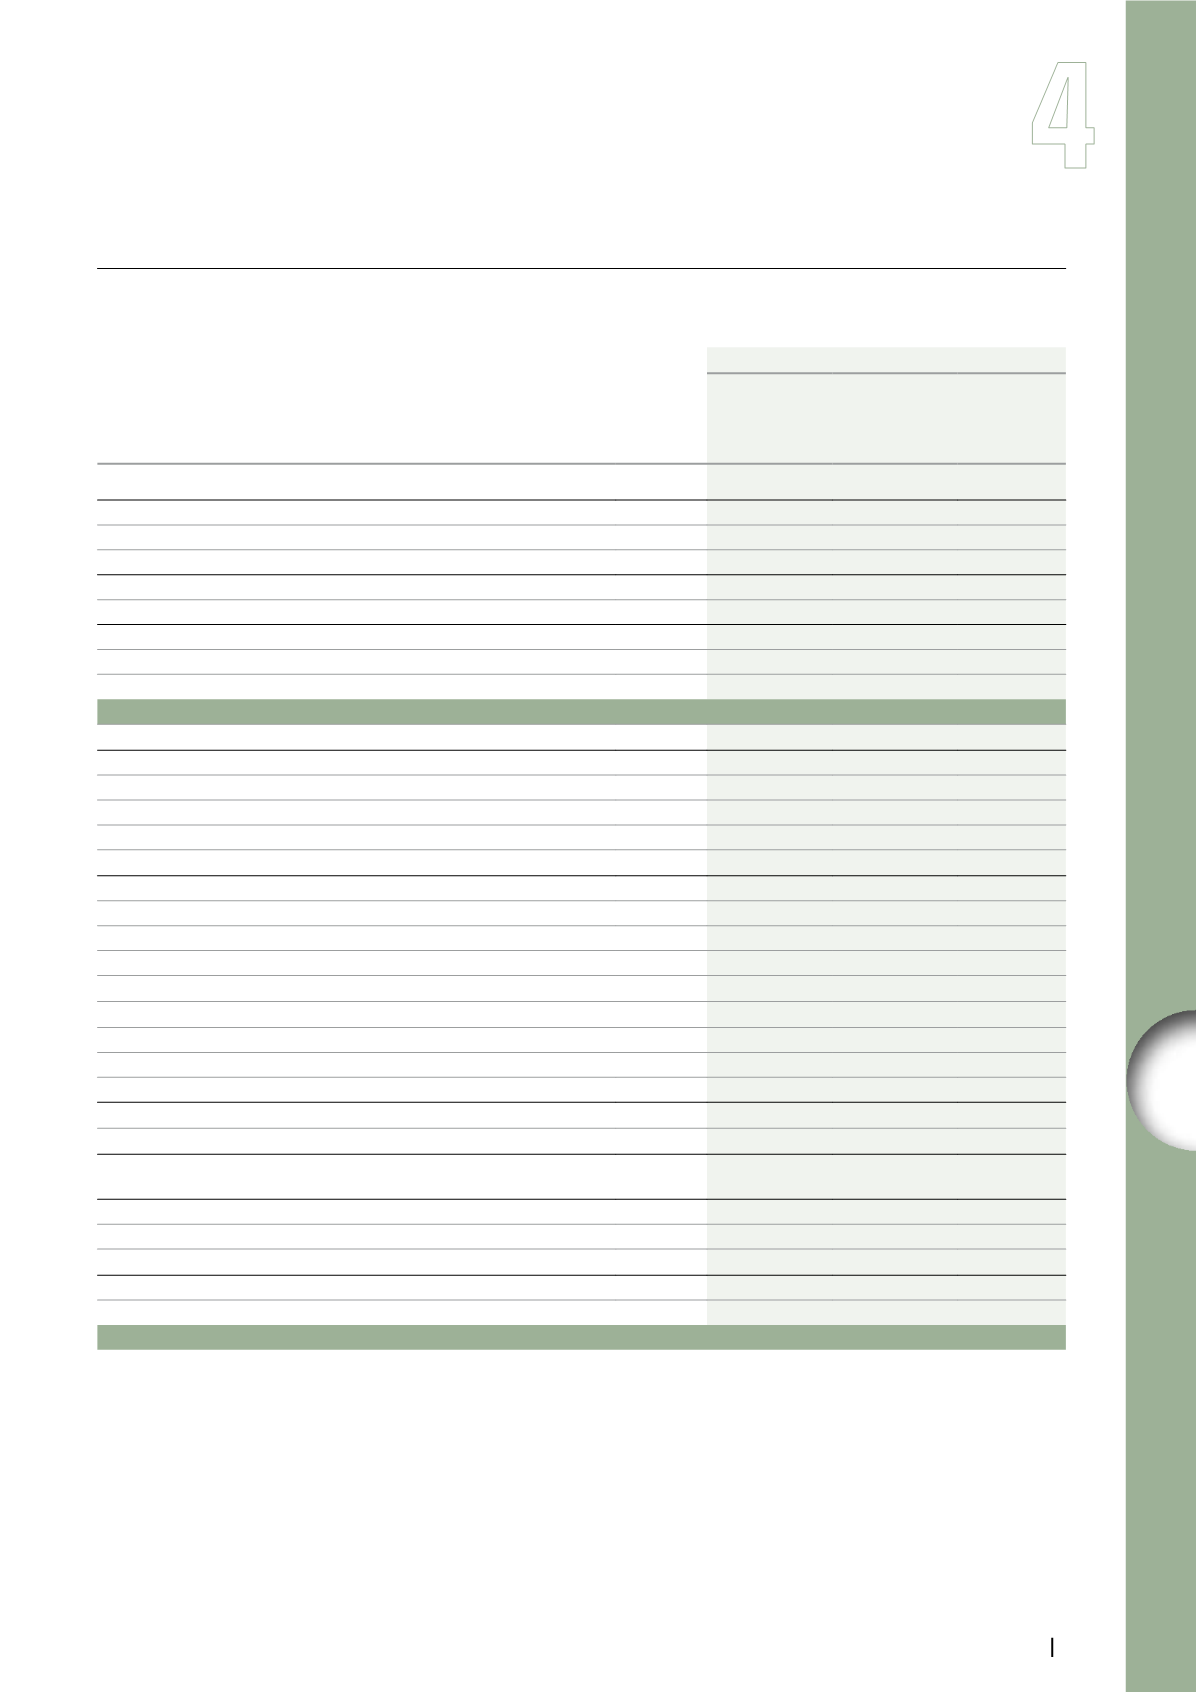
SECTION 5 - Treasury and capital resources
5.3.
Analysis of Financial Net Debt changes
Please refer to the next page for the end of this table.
(in millions of euros)
Refer to
section
Year ended December 31, 2013
Impact on
cash and cash
equivalents
Impact on
borrowings and
other financial
items
Impact on
Financial
Net Debt
EBIT
2
435
-
435
Adjustments
(4,911)
-
(4,911)
Content investments, net
148
-
148
Gross cash provided by operating activities before income tax paid
(4,328)
-
(4,328)
Other changes in net working capital
308
-
308
Net cash provided by operating activities before income tax paid
3
(4,020)
-
(4,020)
Income tax paid, net
3
197
-
197
Net cash provided by operating activities of continuing operations
(3,823)
-
(3,823)
Net cash provided by operating activities of discontinued operations
(1,417)
-
(1,417)
Operating activities
(5,240)
-
(5,240)
Financial investments
Purchases of consolidated companies, after acquired cash
43
15
58
Investments in equity affiliates
2
-
2
Increase in financial assets
106
(2)
104
Total financial investments
151
13
164
Financial divestments
Proceeds from sales of consolidated companies, after divested cash
(2,748)
63
(2,685)
of which proceeds from the sale of the 88% ownership interest in Activision Blizzard
1
(6,044)
-
(6,044)
divested cash of Activision Blizzard
3,286
63
3,349
(2,758)
63
(2,695)
Disposal of equity affiliates
(8)
-
(8)
Decrease in financial assets
(727)
-
(727)
of which proceeds from the sales of Parlophone and other labels by UMG
1
(699)
-
(699)
Total financial divestments
(3,483)
63
(3,420)
Financial investment activities
(3,332)
76
(3,256)
Dividends received from equity affiliates
(3)
-
(3)
Dividends received from unconsolidated companies
(54)
-
(54)
Net investing activities excluding capital expenditures and proceeds
from sales of property, plant, equipment and intangible assets
(3,389)
76
(3,313)
Capital expenditures
2,674
-
2,674
Proceeds from sales of property, plant, equipment and intangible assets
(50)
-
(50)
Capital expenditures, net
3
2,624
-
2,624
Net cash provided by/(used for) investing activities of continuing operations
(765)
76
(689)
Net cash provided by/(used for) investing activities of discontinued operations
1,952
(1,467)
485
Investing activities
1,187
(1,391)
(204)


